
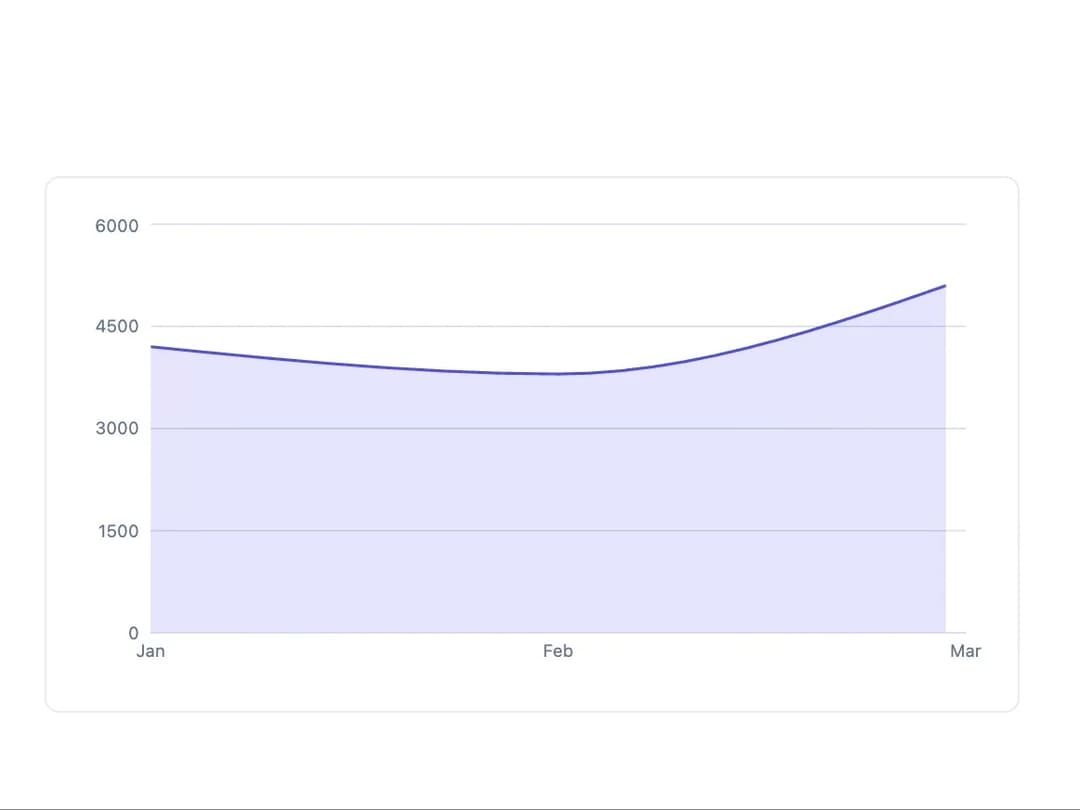
About
A token-themed line, bar, and area chart for dashboards built on recharts, with a design-system-driven color palette and tooltip.
Built with React and Tailwind. Copy the prompt and paste it into Claude Code, Cursor or Lovable: your agent adds Chart to your project and fits it to your theme.
Code
How Chart is used: the demo's code. The component's own source comes with a free account.
Usage.tsx
import { AreaChart } from "@/components/ui/chart";

export default function ChartAreaDemo() {
  return (
    <div className="w-full max-w-2xl rounded-lg border border-border bg-background p-6">
      <AreaChart
        data={[
          { month: "Jan", revenue: 4200 },
          { month: "Feb", revenue: 3800 },
          { month: "Mar", revenue: 5200 },
        ]}
        xKey="month"
        series={[{ key: "revenue" }]}
      />
    </div>
  );
}
Dependencies
More by mohammed-saif-ibrahim
View all
Select
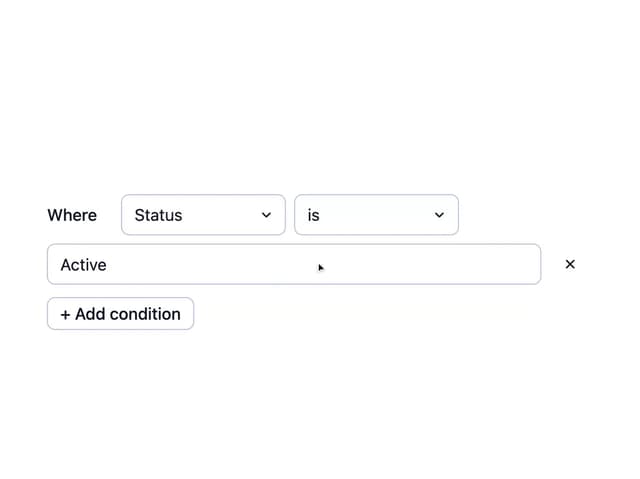
Filter Builder
File Upload
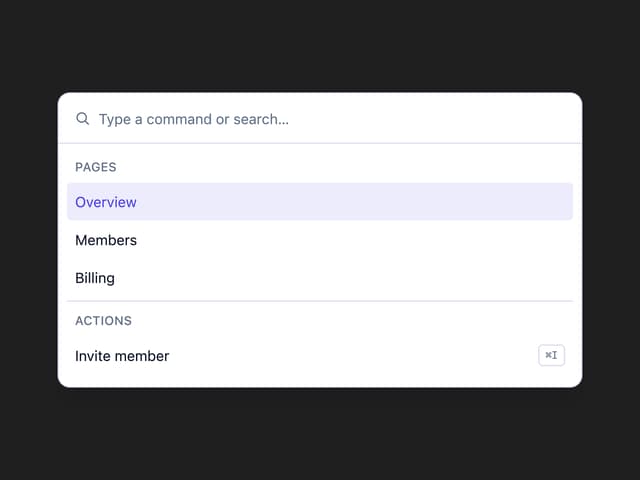
Command Palette
Checkbox

Activity Feed
More in Dashboards
View all
Dashboard with Collapsible Sidebar
2.5K

Sidebar
286

SaaS Template
2.5K

Course Design Cards
1.1K

Chat template
614

System Status Block
316

Statistics Card 7
301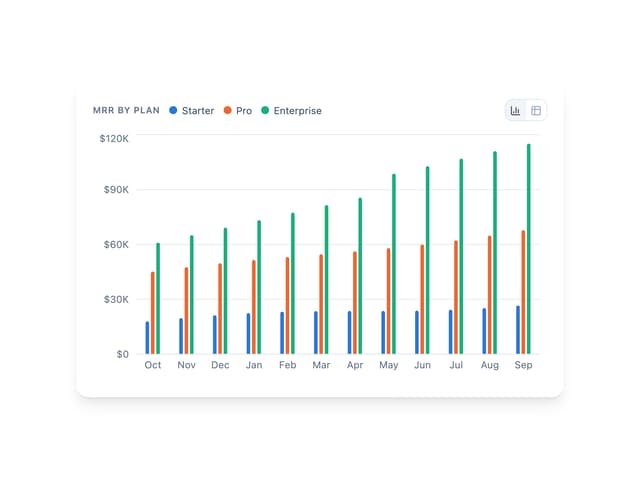
Bar Chart
1

