
About
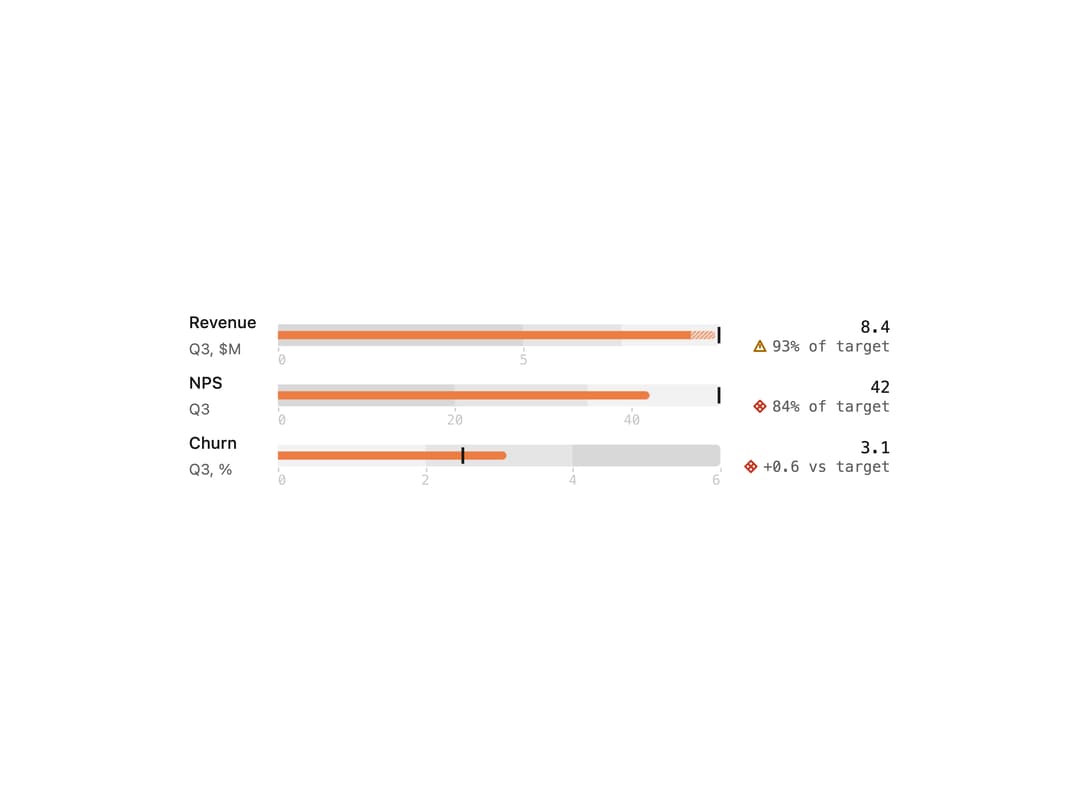
A compact canvas-rendered KPI chart that plots an actual value as a bar against qualitative performance bands and a target tick, for comparing several metrics against their goals in one view.
Built with React and Tailwind. Copy the prompt and paste it into Claude Code, Cursor or Lovable: your agent adds Bullet Chart to your project and fits it to your theme.
Code
How Bullet Chart is used: the demo's code. The component's own source comes with a free account.
Usage.tsx
import { BulletChart } from "@/components/ui/bullet-chart";

export default function BulletChartDemo() {
  return (
    <div className="w-full max-w-xl p-6">
      <BulletChart
        ariaLabel="Quarterly KPIs"
        rows={[
          {
            id: "revenue",
            label: "Revenue",
            sublabel: "Q3, $M",
            value: 8.4,
            target: 9,
            ranges: [5, 7, 9],
            projected: 8.9,
          },
          {
            id: "nps",
            label: "NPS",
            sublabel: "Q3",
            value: 42,
            target: 50,
            ranges: [20, 35, 50],
          },
          {
            id: "churn",
            label: "Churn",
            sublabel: "Q3, %",
            value: 3.1,
            target: 2.5,
            ranges: [2, 4, 6],
            better: "lower",
          },
        ]}
      />
    </div>
  );
}
More by Isaiah
View all
Agent Plan
2.2K
Video Scroll Hero
1.4K
Voice Powered Orb
1.4K
Reveal Text
1.1K
Leads Data Table
943
Portfolio Gallery
939
Message Dock
841
Ruler Carousel
628
More in Dashboards
View all
Dashboard with Collapsible Sidebar
2.5K

Sidebar
286

SaaS Template
2.5K

Course Design Cards
1.1K

Chat template
614

System Status Block
316

Statistics Card 7
301
Bar Chart
1

