
About
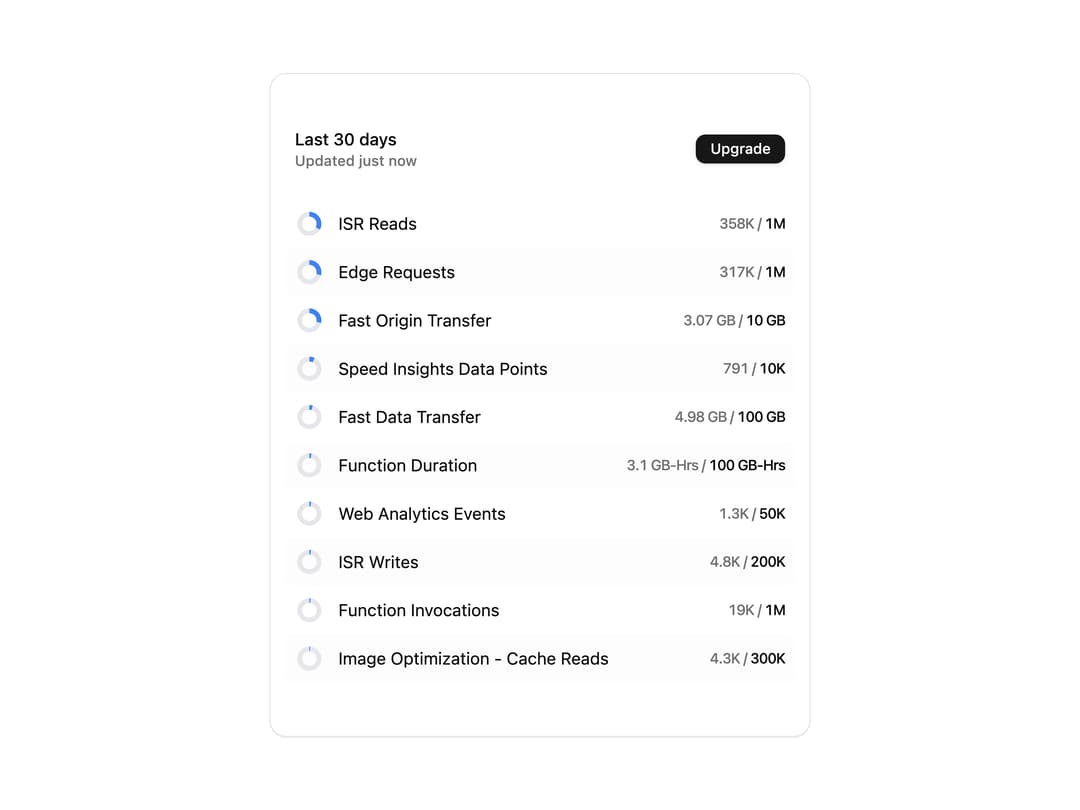
A usage stats card that lists metered resources with small donut-chart indicators showing percentage of limit used, plus current/limit values and an upgrade button.
Built with React and Tailwind. Copy the prompt and paste it into Claude Code, Cursor or Lovable: your agent adds Stats Usage Dashboard to your project and fits it to your theme.
Code
How Stats Usage Dashboard is used: the demo's code. The component's own source comes with a free account.
Usage.tsx
import Stats12 from "@/components/ui/stats-12";

export default function Stats12Demo() {
  return (
    <div className="flex w-full items-center justify-center p-8">
      <Stats12 />
    </div>
  );
}
Dependencies
More by Ephraim Duncan
View all
Stats
148
Stats cards with links
124
Form Layout
97
File Upload
86
login
82
Share Dialog
52
Login & Signup
50
Form
49
More in Pricing
View all
Pricing Section
606
pricing section
166

Pricing Section
181

Pricing Card
372

RuixenPricing05
103

Pricing Cards
17

Boxly Pricing-1
90
Colorful-Pricing
86


