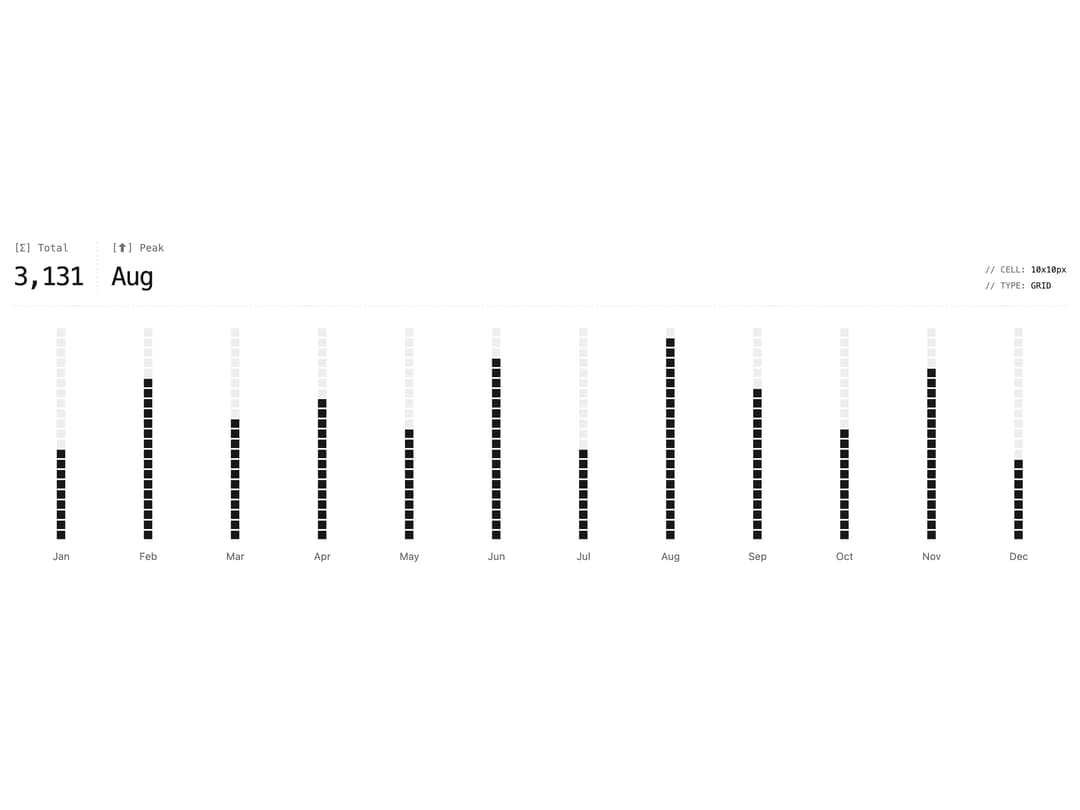
About
A bar chart where each bar is rendered as a stack of small square cells instead of a solid rectangle, with faint background squares showing the full column height.
Built with React and Tailwind. Copy the prompt and paste it into Claude Code, Cursor or Lovable: your agent adds Grid Bar Chart to your project and fits it to your theme.
Code
How Grid Bar Chart is used: the demo's code. The component's own source comes with a free account.
Usage.tsx
import GridBarChart from "@/components/ui/grid-bar-chart";

export default function GridBarChartDemo() {
  return (
    <div className="w-full h-[420px]">
      <GridBarChart />
    </div>
  );
}
Dependencies
More by Legion Dev
View all
CPU Architecture
1.9K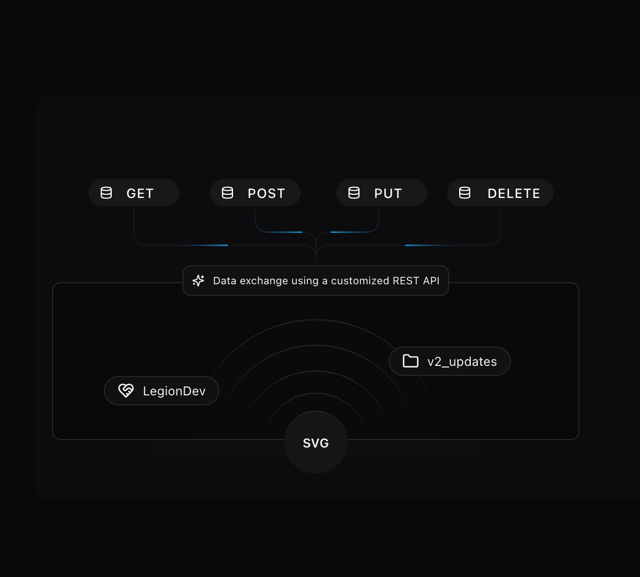
Database With REST API
1.2K
Radar Chart
359
Pie Chart
230
Line Chart
127
Area Chart
112
Bar Chart
100
LegionWebDev
88
More in Dashboards
View all
Dashboard with Collapsible Sidebar
2.5K

Sidebar
286

SaaS Template
2.5K

Course Design Cards
1.1K

Chat template
614

System Status Block
316

Statistics Card 7
301
Bar Chart
1

